Rango de RTP y Evolución del Catálogo (2014-2019)
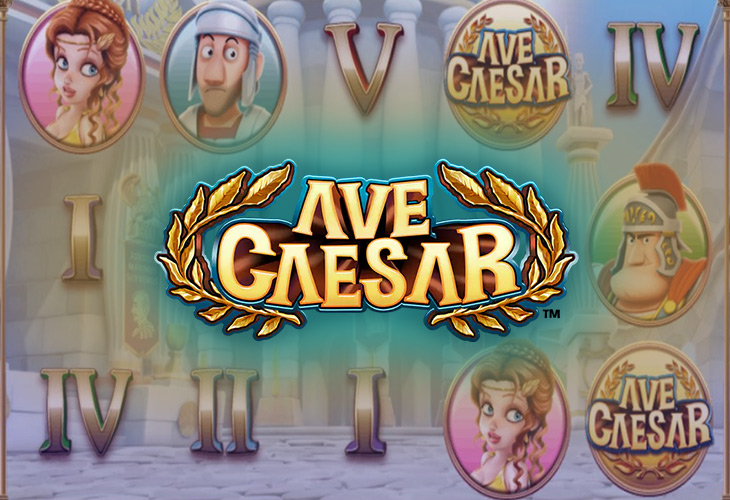
En 10 títulos catalogados entre 2014 y 2019, Leander Games promedia un 95.6% de RTP (mediana 95.89%) con una amplitud de 4.83 puntos entre su título menor (Apollo God of the Sun, 94.17%) y su máximo (Ave Caesar (99%)). 8 juegos (80%) incluyen demo HTML5 verificada.
Perfil de Volatilidad, Cuadrículas y Géneros
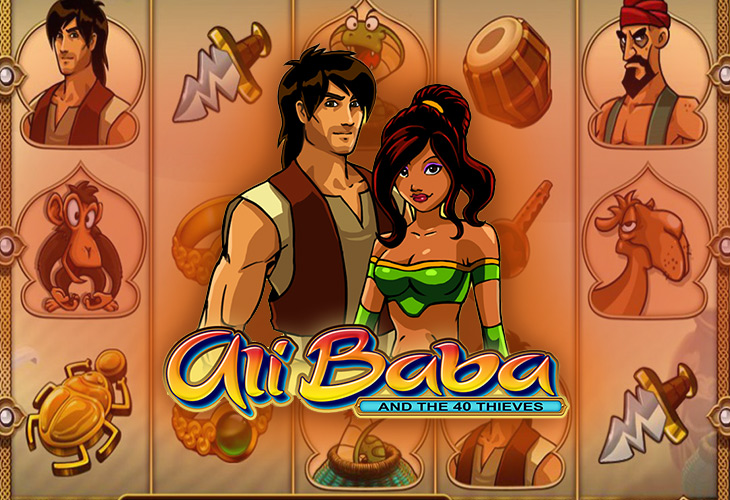
La volatilidad predominante en Leander Games es Media (7 / 70%), destacando Ali Baba and the 40 Thieves (125,000x). Los tableros más frecuentes son 5x3 (9), 5x4 (1) en géneros como History, Aventura, Animales, Sci-Fi, Animales.
Estadísticas y Perfil: Leander Games
| RTP (Mín / Mediana / Máx) | 94.17% / 95.89% / 99% |
| Mayor RTP | Ave Caesar (99%) |
| Mayor Max Win | Ali Baba and the 40 Thieves (125,000x) |
| Géneros principales | History · Aventura · Animales · Sci-Fi · Animales |
Media: 7Alta: 2No data: 1
Slots de Leander Games (10)


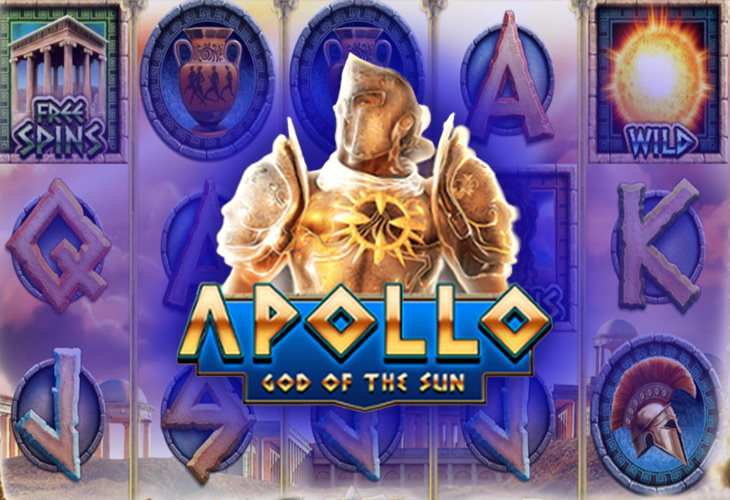
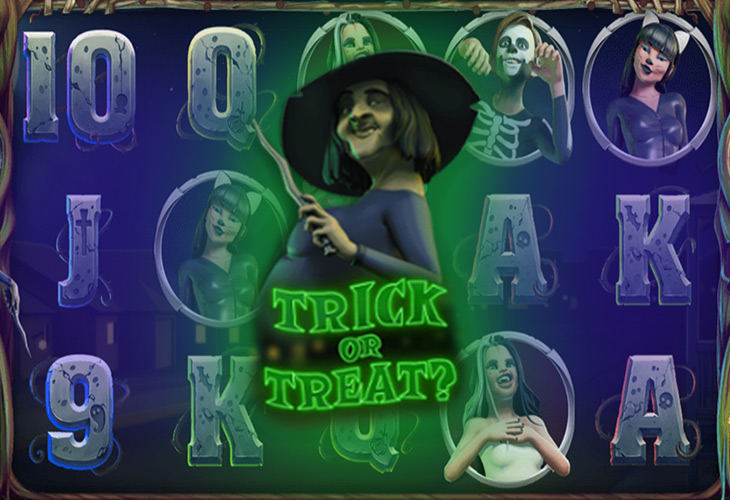
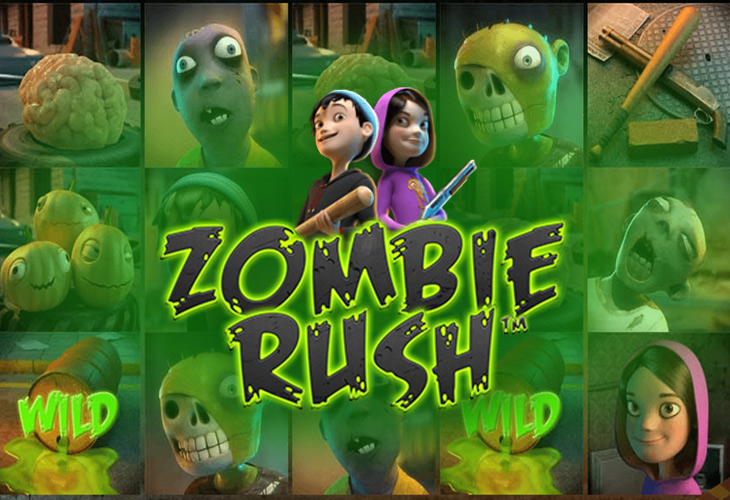
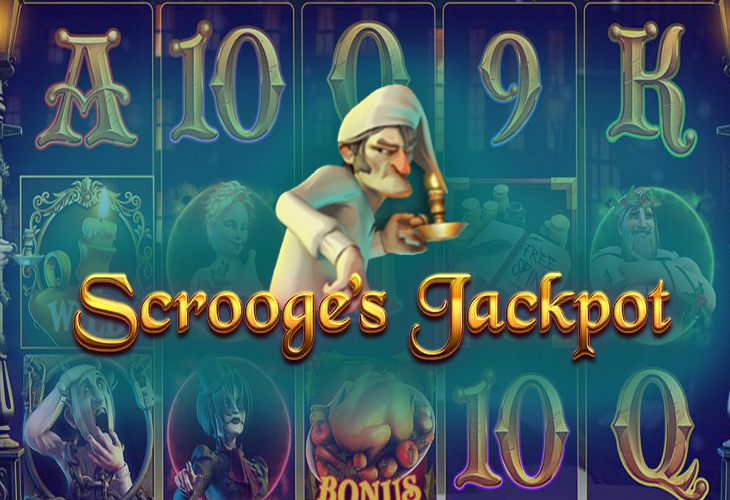
| Título | Año y Cuadrícula | RTP | Max Win | Volatilidad | Abrir |
|---|---|---|---|---|---|
| Ave Caesar | 2017 · 5×3 | 99% | 1,000x | Alta | Demo → |
| Ali Baba and the 40 Thieves | 2018 · 5×3 | 96.59% | 125,000x | Media | Demo → |
| Wild Jane | 2017 · 5×3 | 96.59% | 2,000x | Alta | Demo → |
| Force of Nature | 2018 · 5×3 | 95.9% | 1,000x | Media | Demo → |
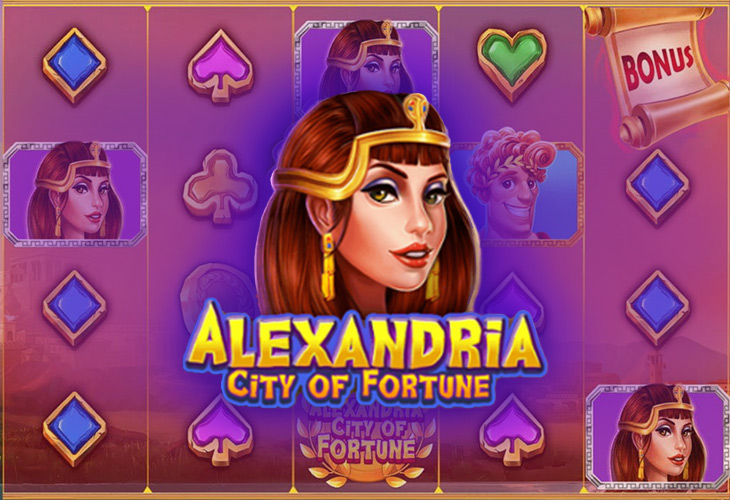
| Alexandria City Of Fortune | 2019 · 5×4 | 95.89% | 5,000x | No data | Demo → |
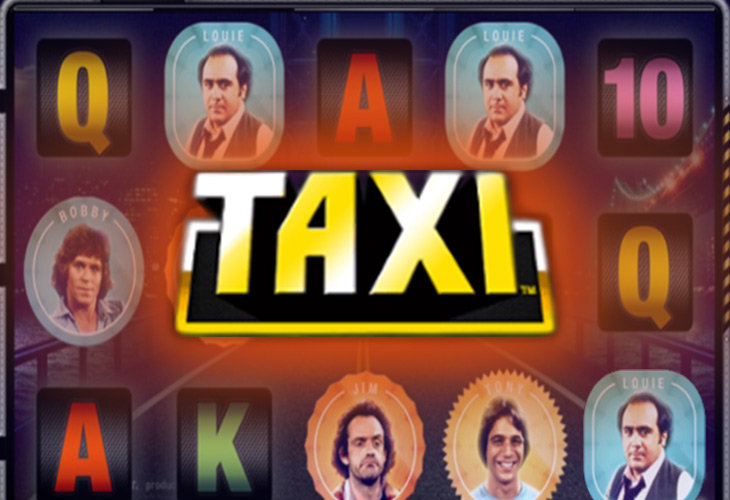
| Taxi | 2015 · 5×3 | 94.62% | 4,000x | Media | Demo → |
| Apollo God of the Sun | 2017 · 5×3 | 94.17% | 25,000x | Media | Demo → |
| Trick or Treat | 2017 · 5×3 | 94.17% | 5,000x | Media | Demo → |
| Zombie Rush | 2014 · 5×3 | 94.89% | 2,000x | Media | Ficha → |
| Scrooge’s Jackpot | 2017 · 5×3 | 94.17% | - | Media | Ficha → |